X-trader NEWS
Open your markets potential
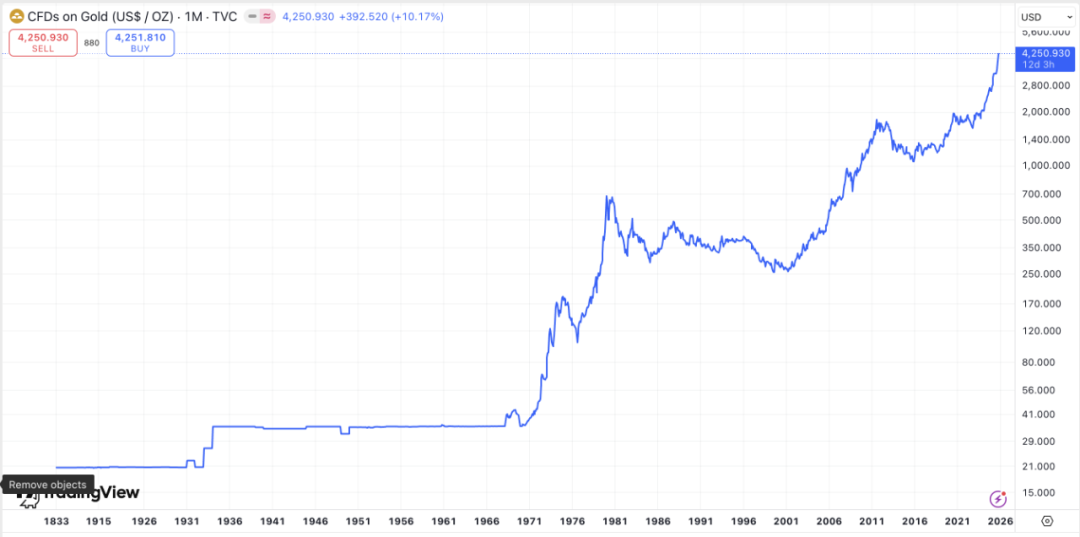
Rising over 66% this year, the logic behind gold’s success

The price of gold once exceeded US$4,378 per ounce, with an increase of more than 66% during the year, the best annual performance since 1979.
Tracing the origin of the surge: The US dollar’s credit cracks resonate with multiple factors
The century-old game between gold and the U.S. dollar
The relationship between gold and the US dollar is the core code for interpreting gold price fluctuations. The history of the game between the two can be traced back to the 20th century. In 1944, the Bretton Woods System established a dual-peg mechanism in which the U.S. dollar was pegged to gold and each country's currency was pegged to the U.S. dollar. At this time, gold became the anchor of U.S. dollar credit, and the gold price was fixed at $35 per ounce. In 1971, the Nixon administration announced the decoupling of the U.S. dollar from gold, marking the official arrival of the era of credit currency. Gold shifted from a currency attribute to an investment attribute. However, the negative correlation of "when the U.S. dollar falls and gold rises" continues to this day.
# Gold Market Analysis: Correlation with the U.S. Dollar, Driving Factors, and Comparative Insights with Bitcoin
Data shows that the correlation between gold and the U.S. Dollar Index over the past 50 years has been -0.68. This negative correlation becomes even more pronounced, especially during critical periods when the U.S. dollar credit system is under stress. For instance, after the collapse of the Bretton Woods system in 1971, the price of gold surged from $35 per ounce to $850 per ounce over a decade. During the 2008 financial crisis, a short-term plunge in the U.S. Dollar Index caused gold prices to double within two years. The sharp rise in gold prices in 2025 is essentially a re-enactment of this historical pattern.
## U.S. Dollar Credit Crisis: The Core Driver of This Round of Growth
In 2025, the U.S. dollar credit system faced multiple shocks, emerging as a key driver behind gold’s breakthrough. From a fundamental perspective:
- The U.S. national debt exceeded $37 trillion, and government shutdowns occurred again.
- The regional banking credit crisis continued to escalate.
- The launch of U.S. dollar stablecoins may also undermine the U.S. dollar’s credit. Through stablecoins, the U.S. government could bypass the Federal Reserve to gain "indirect seigniorage" — via the path of "issuing and mortgaging U.S. Treasuries → issuing U.S. dollar stablecoins → exchanging for U.S. dollars," the government could implicitly seize the seigniorage of digital U.S. dollars and interfere with the monetary policy independence of the Federal Reserve.
These issues have continuously eroded market trust in the U.S. dollar. As a non-credit monetary asset, gold does not rely on the sovereign endorsement of any country, making it a natural first choice for hedging U.S. dollar risks.
The Federal Reserve’s shift in monetary policy has further reinforced the short-term weak U.S. dollar trend. On September 17, 2025, the Federal Reserve initiated an interest rate cut, lowering the federal funds rate to the range of 4.00%-4.25%. The dot plot signaled an additional 50 basis points cut within the year, and market expectations for a 25-basis-point cut in October reached a high probability of 98%. The U.S. Dollar Index has fallen by more than 8% from its annual peak, while the real yield on 10-year U.S. Treasuries has dropped from 4.5% to 3.2%. As real yields decline, the allocation value of gold — a zero-yield asset — has significantly increased.
## Resonance from the Overlay of Geopolitical Risks and Inflation Expectations
In 2025, the global geopolitical risk index rose to its highest level in nearly a decade. Ongoing events such as the escalation of the Russia-Ukraine conflict and tensions in the Middle East have continuously fueled market risk aversion. Over the past two months, gold prices have increased by more than 10% monthly, highlighting the market’s risk-averse sentiment.
On the inflation front, although global core inflation has fallen to 3.2%, it remains above the 2% target of major central banks. Moreover, energy and food price volatility triggered by geopolitical conflicts may push inflation higher again. Historical data shows that since the collapse of the Bretton Woods system in 1971, gold prices have risen by more than 50 times, far outpacing the global average annual inflation rate of 3.5%. During the global high-inflation cycle from 2020 to 2023, gold achieved an annualized growth rate of 12.3%, significantly outperforming the 6.8% global average annual inflation rate over the same period. This anti-inflation attribute has driven continuous capital inflows into the gold market.
## Capital Map: Dual Drivers from Long-Term Allocation and Medium-Term Investment
### Central Banks: "Cornerstone" Long-Term Buyers
Continuous purchases by global central banks serve as the most stable support for the gold market. This allocation is by no means short-term speculation but a long-term layout based on national strategies. Data shows that global central banks have increased their gold holdings by over 1,000 tons annually for three consecutive years, and 95% of surveyed central banks expect official reserves to continue growing in the next 12 months. China’s central bank has been particularly prominent, increasing its gold reserves for 11 consecutive months. By the end of September, its gold reserves reached 74.06 million ounces, a nearly 10% increase from the start of the year.
Structurally, central banks of emerging markets are the main force behind the purchases. Over the past five years, the share of gold in their reserves has risen from 10% to 18%. The core logic for central banks to increase gold holdings lies in hedging U.S. dollar credit risks, maintaining financial stability, balancing asset portfolios, and combating inflation. Essentially, it is about diversifying foreign exchange reserves by increasing gold holdings and reducing reliance on U.S. dollar assets. The scale of gold reserves is also an important symbol of a country’s credit and financial strength, which can enhance international market confidence in its currency. This "official reserve-level" demand forms rigid support for gold prices, enabling quick recovery even amid short-term corrections.
### Financial Institutions: Strategy-Driven Core Traders
Various financial institutions constitute the backbone of the gold market, and their behaviors exhibit both trend-following and strategic characteristics.
Take public funds as an example: Public funds passively respond to investor demand through gold ETFs. From September to October 2025, global gold ETFs recorded a monthly net inflow of $17.3 billion. Among them, the holdings of the world’s largest gold ETF (SPDR Gold Shares) increased by 45% from the start of the year, and the scale of China’s Huaxia Gold ETF (518850) exceeded 30 billion yuan.
### Retail Investors: Full Entry from Consumption to Investment
The large-scale inflow of retail capital is also a key driver of the market rally, featuring dual impetus from consumption and investment.
- **Consumption Side**: Demand remains strong in traditional gold-consuming countries such as China and India. Alone, China’s wedding market consumes over 300 tons of gold annually. In 2025, sales of physical gold at gold stores increased by 28% year-on-year. Even as the price of gold jewelry from brands like Chow Tai Fook stabilized at 1,247 yuan per gram, supply still fell short of demand.
- **Investment Side**: Performance is even stronger. Retail investment purchases rose by 45% year-on-year, sales of gold bars and coins doubled, and products such as paper gold and gold accumulation plans are highly favored. The scale of ICBC’s "Accumulated Gold" exceeded 50 billion yuan in 2025. The core motivations for retail investors to enter the market include anti-inflation, hedging stock market volatility, and following trends. Particularly after gold prices broke through historical highs, the "herd effect" of chasing rallies significantly boosted market trading volume.
## Practical Considerations for Gold’s Safe-Haven Function
### Preservation Efficacy in Conventional Inflation
In an environment of ordinary inflation, gold’s ability to preserve value has been repeatedly verified by history. During the global high-inflation cycle from 2020 to 2023, gold prices rose from $1,700 per ounce to $2,500 per ounce, with an annualized growth rate of 12.3% — far exceeding the 6.8% global average annual inflation rate over the same period — effectively protecting the purchasing power of assets.
For individual investors, allocating 5%-10% of their assets to gold can effectively hedge against the erosion of wealth by rising prices. In terms of allocation tools:
- Gold ETFs, with high liquidity and low transaction costs, are suitable for ordinary investors.
- Physical gold such as gold bars and coins is more favored by investors who value the sense of holding physical assets, but storage costs and liquidity constraints need to be considered.
### Safe-Haven Boundaries in Extreme Environments
In extreme scenarios such as wars, gold’s attribute as a "crisis hedge" becomes prominent, but there are also potential risks.
Gold is a cross-cycle wealth carrier. It is the most reliable "asset preservation tool" during wars and holds irreplaceable value in the post-war recovery phase. For example, in Germany after World War I, war reparations triggered hyperinflation, and the mark exchange rate collapsed — 1 U.S. dollar was equivalent to 64 marks in 1921 and soared to 4.2 trillion marks in 1923. This meant that the wealth of residents holding marks was wiped out, while those holding gold maintained the value of their wealth (in 1923, 1 ounce of gold could be exchanged for 12,000 marks at the beginning of the year and 4.2 trillion marks at the end, fully hedging hyperinflation). During such periods, holding gold across war cycles allows for rapid wealth recovery after the war; gold holders can use it to rebuild homes and invest in industries, while those holding fiat currency may face the risk of currency becoming invalid.
However, individuals storing gold need to be alert to policy risks. Historically, there have been numerous cases of governments forcibly expropriating gold during extreme periods:
- During World War II, Nazi Germany issued the *Reich Gold Decree*, forcing citizens to hand over all gold, with severe penalties for non-compliance.
- During the Pacific War, Japan implemented the "Gold Control Order," prohibiting private gold holdings.
- Even in the U.S. during the 1933 Great Depression, Congress passed the *Banking Act of 1933*, revoking the right of private individuals to hold gold and forcibly expropriating civilian gold at a price of $20.67 per ounce. The following year, the official gold price was raised to $35 per ounce — equivalent to "buying low and selling high," directly seizing people’s wealth. When a country faces an existential crisis, personal gold reserves may be at risk of expropriation, which is the boundary of gold’s safe-haven function.
## Extended Reflection: Bitcoin vs. Gold?
### Fundamental Differences in Core Attributes
- Gold is a safe-haven asset during world wars, while Bitcoin is a safe-haven asset for avoiding local wars.
- Gold has been verified over thousands of years, with characteristics of no sovereign endorsement, no credit risk, and strong scarcity, and has long dominated the position of the "ultimate non-credit asset."
- Bitcoin’s "safe-haven attribute" has not yet been tested by extreme crises. In war-torn areas without computers, mobile phones, or even internet and electricity, Bitcoin cannot function as a direct medium of exchange like physical gold. However, if the war is localized and people can move to other safe areas, Bitcoin is easier to carry than gold.
In terms of scarcity:
- Bitcoin’s scarcity is more definite. Global gold reserves are limited and mining costs are high, with annual new output of only about 3,000 tons, but there are occasional reports of large gold deposits being discovered.
- Bitcoin has a fixed total supply of 21 million coins, making its scarcity more certain.
### Significant Differentiation in Market Structure
The differences in the holder structure and market characteristics of the two assets determine the divergence in their price-driving logics.
- The gold market is dominated by long-term capital; central banks and long-term institutional investors hold over 60% of gold, a structure that enables it to withstand short-term liquidity shocks.
- Bitcoin is still dominated by medium-to-short-term capital. Although this cycle has seen an increase in long-term allocation capital (such as national strategic reserves, Bitcoin ETFs, and Bitcoin DATs), its average daily turnover rate remains high, and leveraged trading accounts for over 60%. This high turnover and high leverage make it more prone to sell-offs when risk appetite shrinks. Additionally, Bitcoin has a stronger correlation with the Nasdaq and a weaker correlation with gold, further confirming its "risk asset" attribute rather than a "safe-haven asset" attribute.
### Future Positioning: Complementarity Rather Than Substitution
From a development perspective, Bitcoin and gold are more likely to form a complementary pattern.
- Relying on its millennium-old credit foundation and physical attributes, gold remains a core reserve asset for global central banks and institutions, with irreplaceable value in scenarios such as addressing sovereign credit crises and extreme wars.
- Leveraging blockchain technology, Bitcoin demonstrates unique advantages in areas such as anti-inflation, cross-border payments, global asset allocation, and global wealth mobility.
For individual investors:
- Gold can serve as a "safety cushion" in asset portfolios, providing certain safe-haven and value-preserving functions.
- Bitcoin can be part of high-risk allocations to pursue excess returns brought by technological innovation, but it is necessary to bear the risks of sharp price fluctuations and regulatory uncertainty in some regions.
## Disclaimer
The views expressed in this article are solely those of the author and do not constitute investment advice for this platform. This platform makes no guarantees regarding the accuracy, completeness, originality, or timeliness of the information in the article, nor does it assume any responsibility for any losses arising from the use of or reliance on the information in the article.
Contact: Sarah
Phone: +1 6269975768
Tel: +1 6269975768
Email: xttrader777@gmail.com
Add: 250 Consumers Rd, Toronto, ON M2J 4V6, Canada


 +1 6269975768
 微信
微信 Teams
Teams