X-trader NEWS
Open your markets potential
5 charts to understand the current status of the Bitcoin market

# Bitcoin’s Price Plunge: What the Data Reveals
Author: Anthony Pompliano, Founder and CEO of Professional Capital Management
Bitcoin’s price has plummeted by approximately 30% from its all-time high of $126,000 set on October 6. Year-to-date, Bitcoin’s price gain has turned negative, and its increase over the past 12 months is less than 1%. Unsurprisingly, Bitcoin holders are deeply disappointed with the asset’s performance.
The sentiment online is among the most negative I can remember. But anecdotal evidence on the internet can be misleading—platforms like Reddit or X can function as echo chambers. So, what does the data actually tell us?
The following five charts explain what is happening.
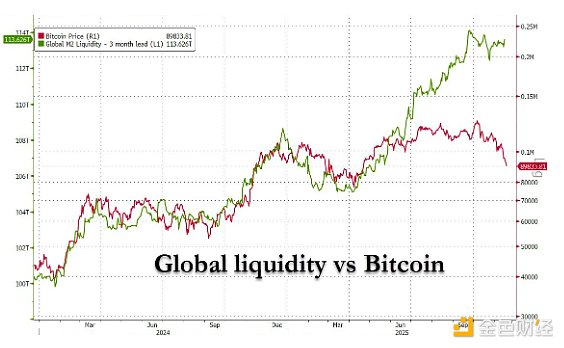
## 1. When Bitcoin was last at this price, global liquidity was $7 trillion lower than it is now
First, data from Zerohedge shows that “when Bitcoin was last at this price, global liquidity was $7 trillion lower than it is today.”
[Image: JrDBS32HZuWRbPmJ6Sxw7Mw8WBSvdYBJbwvjJQHz.png]
This data point strongly contradicts previous expectations. Everyone, including myself, anticipated that Bitcoin would narrow the gap between its price and global liquidity. Since this has not happened, many are questioning whether the market has undergone a fundamental shift as Wall Street begins to embrace this asset.
Regardless of the reason, there is no denying that Bitcoin has dropped 30% in the past month and a half.
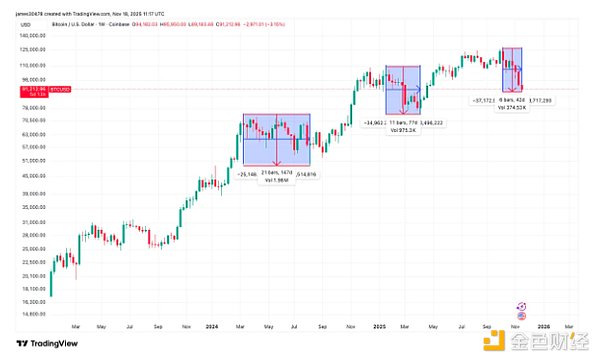
## 2. This is Bitcoin’s “third 30% pullback” in the current cycle
James van Straten explains that this is Bitcoin’s “third 30% pullback” in the current cycle. With each pullback, the time from peak to trough has shortened, accelerating the spread of panic in the market:
- August 2024 (Yen carry trade): 147 days
- April 2025 (Tariffs): 77 days
- November 2025: 42 days
[Image: 0RWYFSouZ6ezVEF7cF2OLtk7R9rCwnv21RvzlT6A.png]
## 3. The current pullback has pushed Bitcoin into the oversold zone
Data from Coin Bureau shows that “Bitcoin’s daily RSI (Relative Strength Index) has dropped to 26, its lowest level since February, indicating that Bitcoin has entered the oversold zone.”
 PREVIOUS:Crypto incubation platform Obex completed US$
NEXT:The total net outflow of Ethereum spot ETF ye
PREVIOUS:Crypto incubation platform Obex completed US$
NEXT:The total net outflow of Ethereum spot ETF ye
Contact: Sarah
Phone: +1 6269975768
Tel: +1 6269975768
Email: xttrader777@gmail.com
Add: 250 Consumers Rd, Toronto, ON M2J 4V6, Canada


 +1 6269975768
 微信
微信 Teams
Teams